What Consumer Sleep Trackers Measure
A wristband does not watch your brain. It watches your wrist — the twitches, the stillness, the pulse under the skin — and then a software model guesses what your brain was doing. That guess is usually decent at separating sleep from wake and weaker at separating one sleep stage from another. This page walks what the sensors physically detect, where the algorithm does its estimating, and why the output of a consumer device is a useful signal rather than a clinical test.
What the evidence supports
- Wrist accelerometry detects sleep vs wake with roughly 90% agreement against lab polysomnography in validation studies — the sleep/wake layer is genuinely solid (Marino et al., Sleep, 2013).
- Consumer devices detect the same sleep/wake distinction; their biggest errors sit in the wake direction, over-reading restless wake as sleep.
- Heart-rate and heart-rate-variability signals add real information about sleep timing and fragmentation that movement alone misses.
What remains uncertain
- Stage estimates (light, deep, REM) are derived, not measured — no consumer wristband records brain waves, and stage-by-stage agreement with EEG is consistently weaker than sleep/wake agreement.
- Accuracy varies by device, firmware version, and sleeper; one model's validated numbers do not transfer to another's app.
- None of this validates the headline "score" — a proprietary daily number that no two manufacturers define the same way.
Evidence last reviewed: August 20, 2026. Conclusions may change as new research is published.
The Sensor Is Not the Score
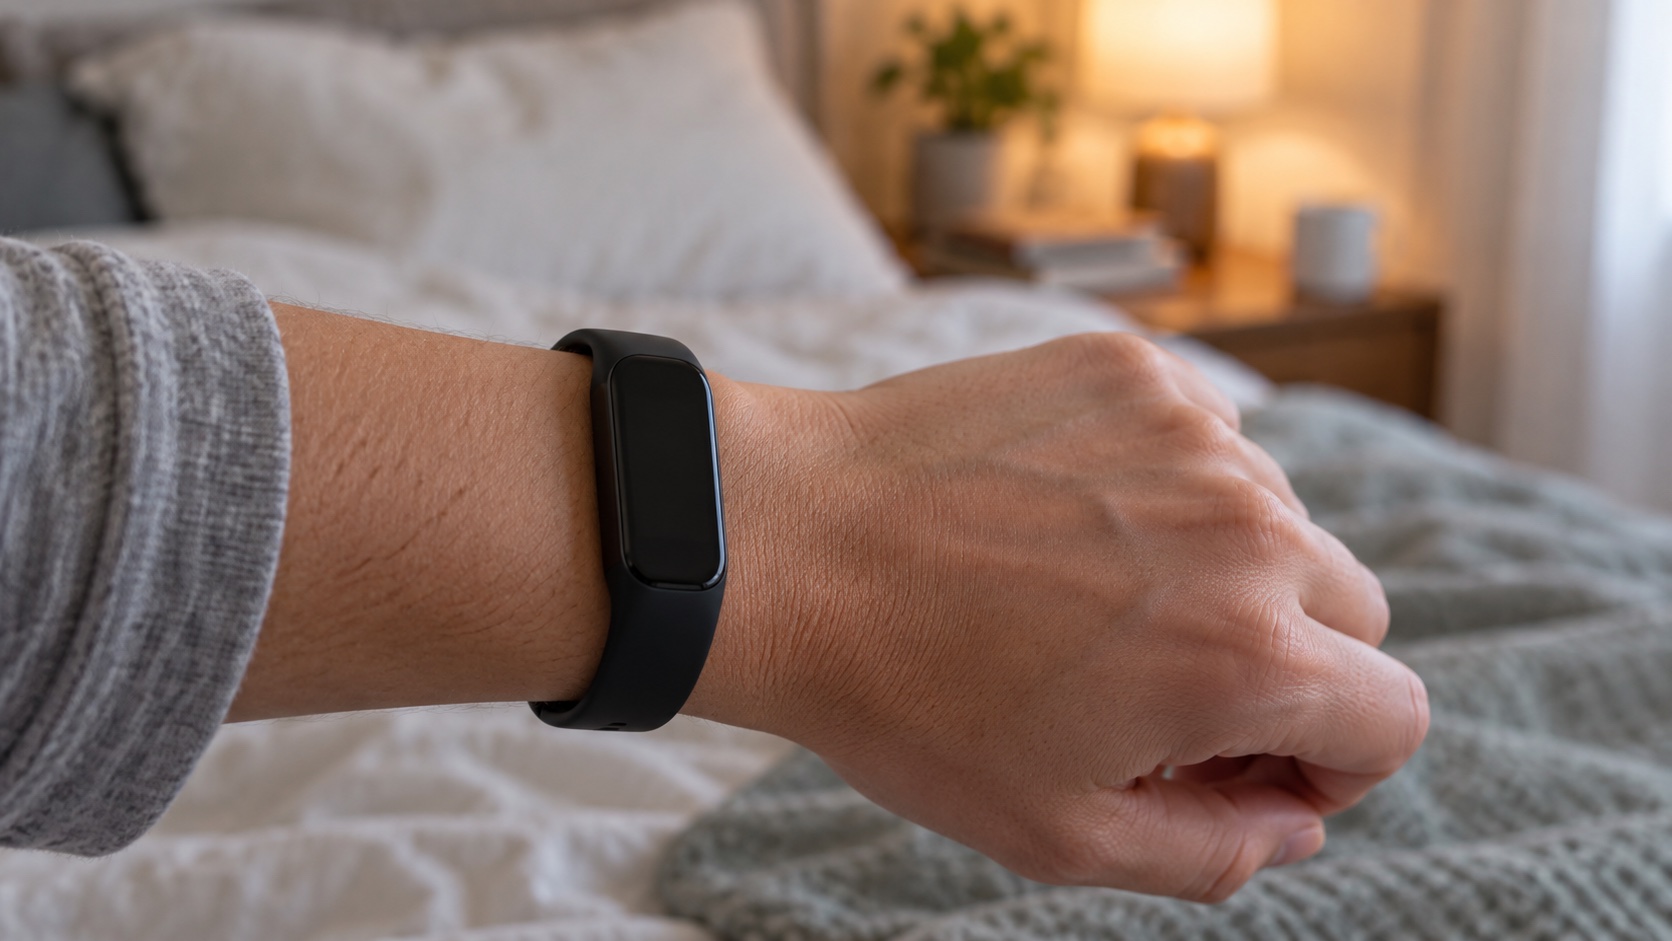
Strip away the app and the dashboard, and a sleep tracker is two sensors in a case. The accelerometer counts movement in three axes — the wrist is nearly still in stable sleep and active in wake. The optical heart-rate sensor fires green or red light into the skin and measures how the light scatters off blood flow, which is how it derives pulse and, in fancier models, breathing rate and heart-rate variability. Everything else on the screen is arithmetic built on top of those two raw streams.
- 📐 Movement is the primary channel — the classic actigraphy logic: still wrist, low activity = sleep; motion bursts = wake or arousal. This layer is the most validated part of the whole device (Marino et al., Sleep, 2013).
- ❤️ Pulse is the secondary channel — heart rate falls in deep sleep and climbs in REM, so the algorithm uses pulse to split time it already guessed was sleep.
- 🧠 Brain waves are never measured — no consumer band has EEG electrodes; every stage label is an inference from movement and pulse, never a recording of the brain.
- 🏷️ The score is a third layer — a proprietary blend of the above plus your input; two brands can score the same night differently and both be "accurate" by their own formula.
Product picks are generic categories, not brands. We may earn a commission on Amazon or iHerb purchases at no cost to you — this never changes our evidence conclusions. Full disclosure
Smart band or smartwatch
Can make activity, exercise, and routine patterns easier to notice over time.
⚠️ Step, heart-rate, and sleep estimates can be inaccurate and may encourage unhelpful over-monitoring; consumer readings are not medical diagnoses.
Check price on Amazon →The Estimation Pipeline: From Motion to Stages
Watch what happens between the sensor and the morning report and you will see the word "estimate" doing a lot of work. The device first decides, epoch by epoch — usually in 30-second or 1-minute blocks — whether you were awake or asleep. That is the solid layer. Then it takes the sleep epochs and distributes them across light, deep, and REM using pulse patterns, movement density, and the time of night. That second step is where the model, not the sensor, is in charge.
- 🎚️ Stage one, sleep vs wake — high agreement with the lab; this is the layer actigraphy has been doing for decades.
- 🔀 Stage two, the stage split — the algorithm assigns REM, light, and deep based on heart-rate features and expected architecture; the agreement here drops noticeably (de Zambotti et al., Medicine & Science in Sports & Exercise, 2019).
- 🔄 The feedback loop — some devices re-score historical nights when you log symptoms or naps, which means this morning's numbers can quietly differ from what you saw yesterday.
- ⏱️ Epoch length changes the picture — short epochs catch more wakefulness; the same night can look different depending on the device's internal resolution.
Where Stage Estimates Fall Apart
The messy part of consumer sleep tech is not whether you were asleep — it is which stage you were in. Validation studies that run devices next to lab EEG find the same pattern repeatedly: the sleep/wake line holds up, and the REM/deep/light split drifts. In the seven-device comparison by Chinoy and colleagues, consumer devices tracked sleep timing and totals reasonably well while stage-by-stage accuracy stayed clearly below the EEG reference (Chinoy et al., Nature and Science of Sleep, 2021).
- 🌊 REM is the usual casualty — devices often mislabel REM as light sleep, especially in the early night when REM episodes are short.
- 🏋️ Deep sleep gets inflated or deflated by movement — a still, shallow sleeper can be credited with deep sleep their EEG would never confirm.
- 😴 Wake inside the night is under-counted — the classic actigraphy bias: long still wake stretches read as sleep (Marino et al., Sleep, 2013).
- 📉 The stage errors are not random — they are systematic, which is worse than noise: a device that over-credits deep sleep will do it most nights, and the trend line will look confident while being wrong.
How Well Devices Agree With the Lab
Put the validation studies on one axis and the picture is a staircase, not a flat line. Agreement is strongest where the sensor is doing the work and weakest where the algorithm is guessing. Bar widths below are qualitative — they encode how much the published device-versus-PSG comparisons associate each output with lab-measured reality, not exact percentages.
What Each Sensor Can and Cannot Tell You
The honest way to use a tracker is to know which column each output lives in. The table below splits the device's claims into what the sensor measures, what the algorithm infers, and how far each should travel.
| Output | Underlying signal | Trust level | Why |
|---|---|---|---|
| ⌚ Sleep vs wake | Accelerometer movement counts | Good | The actigraphy layer with decades of validation behind it |
| ❤️ Overnight heart rate | Optical pulse sensing | Good | Pulse timing is measurable; useful for spotting pattern changes |
| 🌙 Sleep stage estimates | Algorithm over pulse + movement | Moderate | Rough architecture picture; not an EEG substitute |
| 🧠 REM vs light, epoch by epoch | Statistical guess | Weak | Systematically drifts from lab staging in validation studies |
Reading the Numbers Honestly
The practical payoff of knowing the pipeline is that you stop arguing with your device and start using its strong layers. Sleep vs wake, bedtime, wake time, and weekly duration totals are the outputs worth your attention. The stage pie chart is scenery. The daily score is a marketing summary of the scenery.
- ✅ Use the strong layers — timing, duration, and sleep/wake consistency track reality closely enough to guide behavior.
- 🧂 Take the stages with salt — treat deep-sleep minutes as a rough flavor of the night, not a lab measurement; the Deep Sleep vs REM topic owns what those stages actually do.
- 📈 Trends beat single nights — the next page in this folder, The Trend Over the Nightly Score, builds the case for weekly patterns.
- 🩺 Patterns start conversations — if the strong layers show a consistent pattern, that is a talking point for a clinician, not a self-made diagnosis (see Wearables and Clinical Questions).
⚠️ An estimate is not a test
Nothing a wristband reports can diagnose a sleep disorder. A device that flags "low deep sleep" or "elevated waking" is showing you a modeled guess, and the strongest pattern is still a conversation starter. If the numbers or your symptoms suggest sleep apnea or persistent insomnia, the next step is a qualified healthcare professional — not a stronger conclusion drawn from the app.
Questions, Answered Briefly
- ❓ Is my tracker "lying" to me? Not exactly — it is estimating with imperfect sensors. The sleep/wake layer is honest enough to use; the stage layer is a model's best guess, and the daily score is a proprietary blend of both.
- ❓ Why does my device show REM I know I didn't have? Because REM is inferred from heart-rate and movement patterns, and the inference is weakest in the early night, when REM episodes are short and easily misread as light sleep.
- ❓ Are expensive trackers more accurate? Price tracks sensors and software features, not validation. The published device comparisons find a spread in accuracy that does not line up neatly with price tags.
- ❓ Can I compare my tracker to my partner's? Only as a curiosity. Different devices use different algorithms, so two bands on the same night can report different stage totals; the trend view is the fairest comparison available, and even that is approximate.
- ❓ When should the numbers worry me? When the strong layers — duration, timing, consistency — show a persistent pattern that matches symptoms like daytime sleepiness, loud snoring, or pauses in breathing. That combination is a reason for a clinical conversation, not an app diagnosis.
The Bottom Line
- Trackers measure movement and pulse, not sleep itself — everything else on the screen is model output.
- Sleep vs wake is the trustworthy layer — the stage split is where consumer accuracy falls off.
- Stage estimates are systematic, not random — a confident wrong trend is worse than noise.
- Read timing, duration, and trends — and treat any "diagnosis" from an app as a starting point for a clinical conversation.
Related Topics
- Marino M, Li Y, Rueschman MN, et al., "Measuring sleep: accuracy, sensitivity, and specificity of wrist actigraphy compared to polysomnography," Sleep (2013)
- Chinoy ED, Cuellar JA, Huwa KE, et al., "Performance of seven consumer sleep-tracking devices, polysomnography, and actigraphy: case series," Nature and Science of Sleep (2021)
- de Zambotti M, Cellini N, Goldstone A, Colrain IM, Baker FC, "Wearable sleep technology in clinical and research settings," Medicine & Science in Sports & Exercise (2019)
- Kolla BP, Mansukhani S, Mansukhani MP, "Consumer sleep tracking devices: a review of mechanisms, validity and utility," Expert Review of Medical Devices (2016)