The scale-noise problem
Weigh yourself daily and the scale will bounce up and down by a kilogram or more across a week — none of it fat. This page explains where that noise comes from, shows why a single reading is close to meaningless, and gives you the one tool that fixes it: the seven-day moving average, the trend line that turns daily chaos into a signal you can actually act on.
What the evidence supports
- Daily body weight fluctuates with glycogen, water, salt, bowel contents, and hormones — swings that can exceed the weekly fat loss being measured.
- Weighing daily at a fixed time and averaging across a week filters most of that noise and tracks fat-loss trend more reliably than any single reading.
- The odds of accurate fat loss from one day to the next are tiny; multi-day windows are the honest unit of measurement.
What remains uncertain
- The optimal averaging window (five vs seven days) has no settled evidence; seven days is a practical convention rather than a proven optimum.
- Whether daily weighing helps or hurts adherence varies by individual — for some it is motivating, for others it feeds obsession (see the final page of this series).
- Menstrual-cycle water retention means weekly averages still contain predictable, cycle-sized bumps for many women.
Evidence last reviewed: August 15, 2026. Conclusions may change as new research is published.
Product picks are generic categories, not brands. We may earn a commission on Amazon or iHerb purchases at no cost to you — this never changes our evidence conclusions. Full disclosure
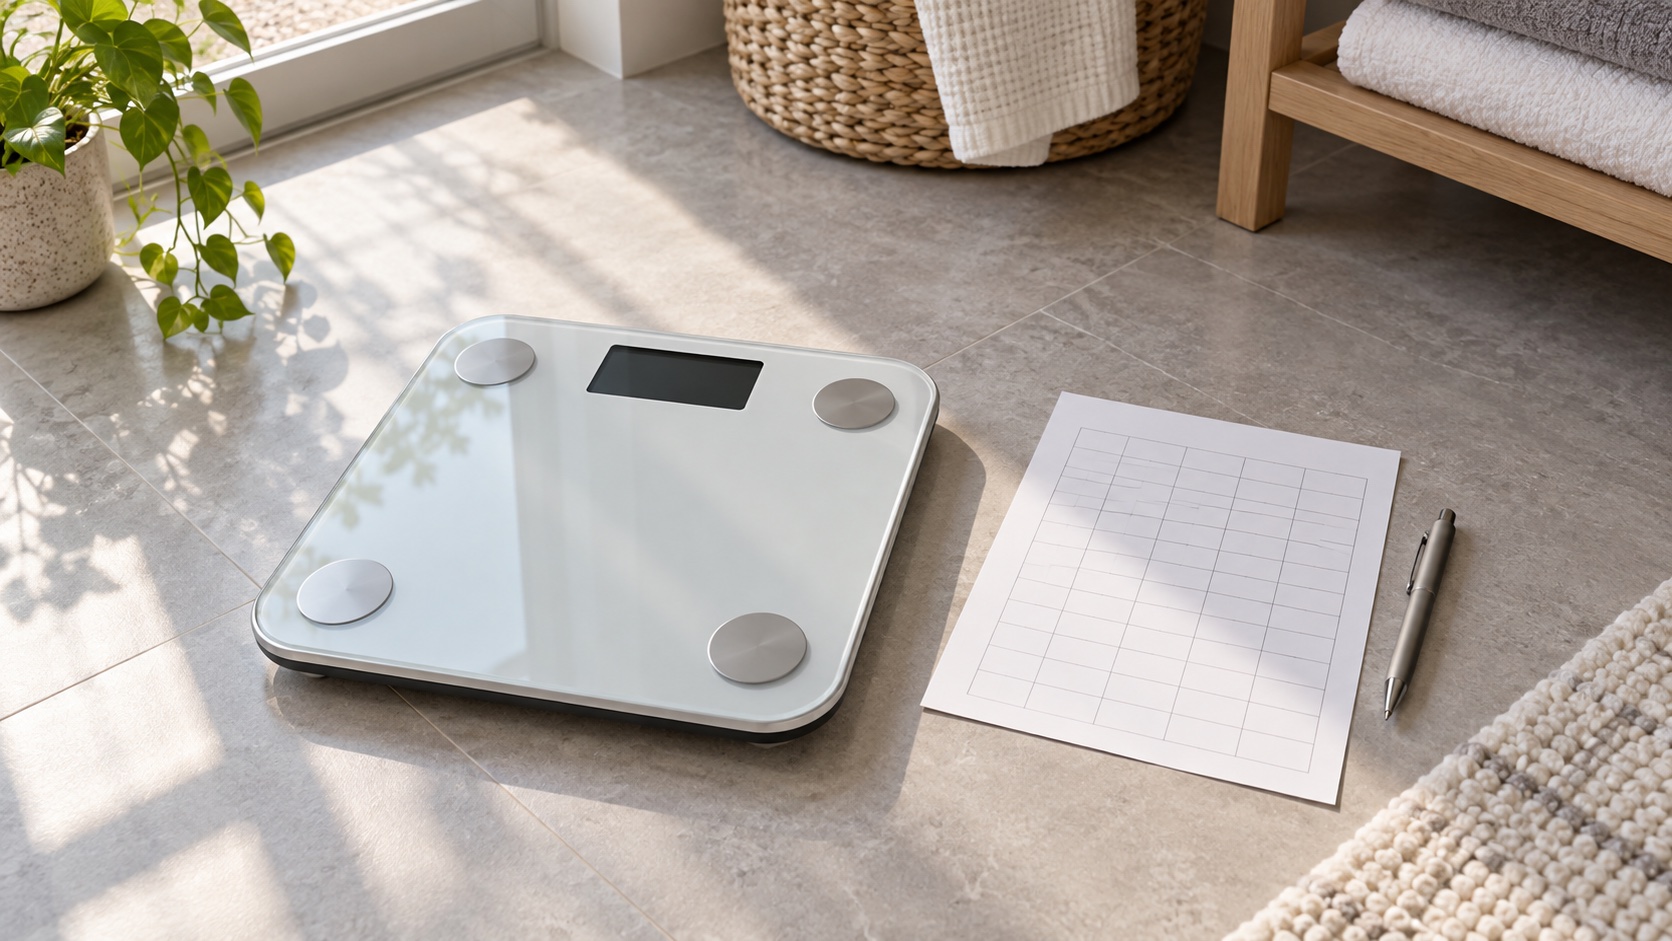
Smart scale with body-composition estimates
Can make body-weight trends easier to observe; body-composition estimates may be used as a rough personal trend only.
⚠️ Bioimpedance estimates vary with hydration and device assumptions; frequent weighing can be unhelpful for people with eating-disorder risk or body-image distress.
Check price on Amazon →Why Today's Number Is Almost Useless
Suppose your true fat loss is a modest, well-executed 500 kcal a day — that is about 45 grams of actual fat per day, or roughly a third of a kilogram over a week. Now picture the scale moving 0.8 kg up overnight after a salty restaurant dinner, a late meal, and a short sleep. The signal you care about (about 70 g a day) is ten times smaller than the noise you are trying to read through. This is the core of the scale-noise problem: the thing you are measuring is real, but the measurement instrument is dominated by everything except the thing you are measuring.
That is why "I gained two pounds overnight" is, in nearly every case, not a statement about fat. The scale cannot tell the difference between a gram of body fat and a gram of water; it reports total mass, and total mass is a noisy mix. The first discipline is therefore to stop reading single readings as verdicts and start reading them as data points in a trend.
Where the Noise Comes From
Most of the daily swing is water, and water in the body is governed by a handful of mechanical levers rather than by your fat cells. Understanding the list makes the noise legible instead of alarming.
- 🧂 Salt and sodium. A high-salt day pulls water into the tissues; the body holds it until sodium is cleared. This alone can move the scale 0.5–1 kg for a day or two.
- 🍞 Carbohydrate and glycogen. Stored carbohydrate binds roughly three grams of water per gram. Restocking glycogen (a higher-carb day) adds visible water weight; depleting it (the first days of a deficit) sheds it — which is why early weight loss looks so dramatic.
- 🌙 Sleep and stress. Poor sleep and raised cortisol alter fluid handling and appetite hormones; a bad night is often followed by a heavier morning that has nothing to do with fat.
- ⚗️ Bowel contents. Transit time varies widely; a few hundred grams of undigested food and water can be on board or not, day to day.
- 🩸 Menstrual cycle. Hormonal water retention in the luteal phase routinely adds a kilogram or more for many women, on a predictable three-to-four-week rhythm.
- ⏰ Timing and scale drift. Weighing at different times, after different meals, on a differently placed or charged scale adds measurement error on top of physiology.
The Seven-Day Moving Average
The fix is embarrassingly simple and mathematically sound: instead of judging today's reading, judge the mean of the last seven readings. The moving average smooths out the single-day spikes because a bad day is only one-seventh of the number. Lose those noisy up-days inside the average and what remains is a genuinely readable trend — and it is the trend, not the day, that should drive every decision in this protocol.
A practical detail: the average only works if the weigh-ins are standardized, because garbage in, garbage out applies to averages too. Weigh at the same time, ideally first thing in the morning after the bathroom and before food or drink, on the same hard, level surface, and don't let one missed morning break the habit — a six-day average is slightly noisier but still fine; a completely abandoned habit helps nobody.
The One-Bad-Day Test
Here is a decision rule worth memorizing: judge nothing on a single reading, act only on a multi-day window. Concretely, the protocol says: no plan adjustment, no panic, no celebration, and no "I can eat it back" from one scale reading. The sole numbers that earn a reaction are the weekly average, the direction it is moving across two or three weeks, and how that direction compares with the rate table in the TDEE page. If you find yourself refreshing the scale twice a day and reacting to each number emotionally, that is the signal itself — the exit strategy page covers when tracking stops being measurement and starts being a problem.
⚖️ The scale is a trend instrument, not a truth instrument
A bathroom scale reports total mass to the nearest tenth of a kilogram and implies a precision that physiology simply does not have. Used once, it can mislead you into abandoning a working deficit over salt intake. Used as a seven-day average, it quietly tells you what you need to know. The struggle is rarely with the scale's number — it is with the instinct to treat one number as the whole story. The honest frame: one observation is a data point, a fortnight is a pattern, and the plan changes on patterns, not on single mornings.
How to Read the Avg — and What to Ignore
| What you see | What it usually means | The move | Read |
|---|---|---|---|
| ⚖️ One day up 0.8 kg | Sodium, carbs, sleep, or timing — not fat | Nothing. Log it in the trend; move on | Ignore |
| 📉 Weekly average flat for 1–2 weeks | Normal stalling; water may be masking loss | Hold the course; extend the window to a month | Hold |
| 📈 Weekly average creeping up 2+ weeks | Intake may be drifting above maintenance | Recheck portions and the TDEE estimate | Adjust |
| 🩸 Same pattern every 3–4 weeks | Likely menstrual-cycle water for many women | Compare same-cycle-week averages, ignore the bump | Ignore+ |
| 📉 Trend dropping 0.5–1% weekly | Exactly on plan | Change nothing; that is the goal | On plan |
Questions, Answered Briefly
- 🕧 Should I weigh every day, or once a week? Daily is better for the trend if you can keep it emotionally neutral. Weekly is worse at detecting the true signal because any single week is one data point. The guide: daily readings in, weekly averages out.
- 🍕 I ate one heavy meal and the scale says +1 kg. Almost all of it is water and food in transit. It will come off within a day or two without any compensation, and it will barely move the seven-day average.
- 🧂 Does drinking more water help the number? It helps digestion and fullness but won't lower the reading meaningfully in the short term; water retention is not solved by dehydration. Keep fluids normal and judge the trend.
- 📱 Should I trust my smart-scale body-fat estimate? No — consumer bioimpedance body-fat numbers are notoriously imprecise and vary with hydration. Use the scale for total weight trend only; body composition is tracked by the body-composition page's methods.
- 😰 Weighing makes me anxious. What do I do? That is a real and common response. Options include switching to weekly averages computed without daily emotion, measuring waist circumference monthly instead, or dropping the scale entirely — the final page of this series deals with exactly this pivot.
The Bottom Line
- Single readings are close to meaningless — daily swings from water, salt, carbs, sleep, and hormones routinely dwarf a full week of real fat loss.
- The water pattern is predictable, not personal — sodium, glycogen, cycle phase, and bowel transit explain nearly all of it; none of it is fat.
- The seven-day average is the instrument — standardized daily weigh-ins smoothed into a weekly mean turn noise into a signal you can trust.
- Act only on the trend — no panic, no reward, no adjustment from one day; decisions belong to multi-week direction, compared against the rate table.
Related Topics
- Helms et al., "Evidence-based recommendations for natural bodybuilding contest preparation: nutrition and supplementation," Journal of the International Society of Sports Nutrition (2014) — weekly-average scale guidance and water/glycogen accounting
- Kreitzman et al., "Glycogen storage: illusions of easy weight loss, excessive weight regain, and distortions in estimates of body composition," American Journal of Clinical Nutrition (1992)