Beyond Omega-3: Protein and Other Nutrients in Seafood
Fish gets discussed as an omega-3 delivery vehicle, which undersells the actual food. A standard serving of seafood brings complete protein at land-meat quantities, a day's worth of vitamin B12, one of the few natural food sources of vitamin D, and dense amounts of selenium and iodine — nutrients that are quietly difficult to get elsewhere. This page is a composition sheet: what is in the package, per official nutrient databases. It deliberately makes no claims about what any of it does for lifespan.
What the evidence supports
- A 3-oz cooked serving of most fish supplies roughly 19–23 g of complete protein — comparable to the same weight of poultry or lean beef.
- Seafood is among the richest natural sources of vitamin B12 and vitamin D; oily fish like salmon deliver near a day's reference value of each per serving.
- Selenium and iodine are concentrated in marine seafood: yellowfin tuna and similar species carry well above a day's selenium value, and cod supplies most of a day's iodine.
What remains uncertain
- Values vary widely by species, wild versus farmed, season, and the fish's own diet — database numbers are averages, not guarantees for any fillet.
- Nutrient content says nothing by itself about health outcomes; those questions live on the outcomes page.
Evidence last reviewed: October 6, 2026. Conclusions may change as new research is published.
The Protein Comes Standard
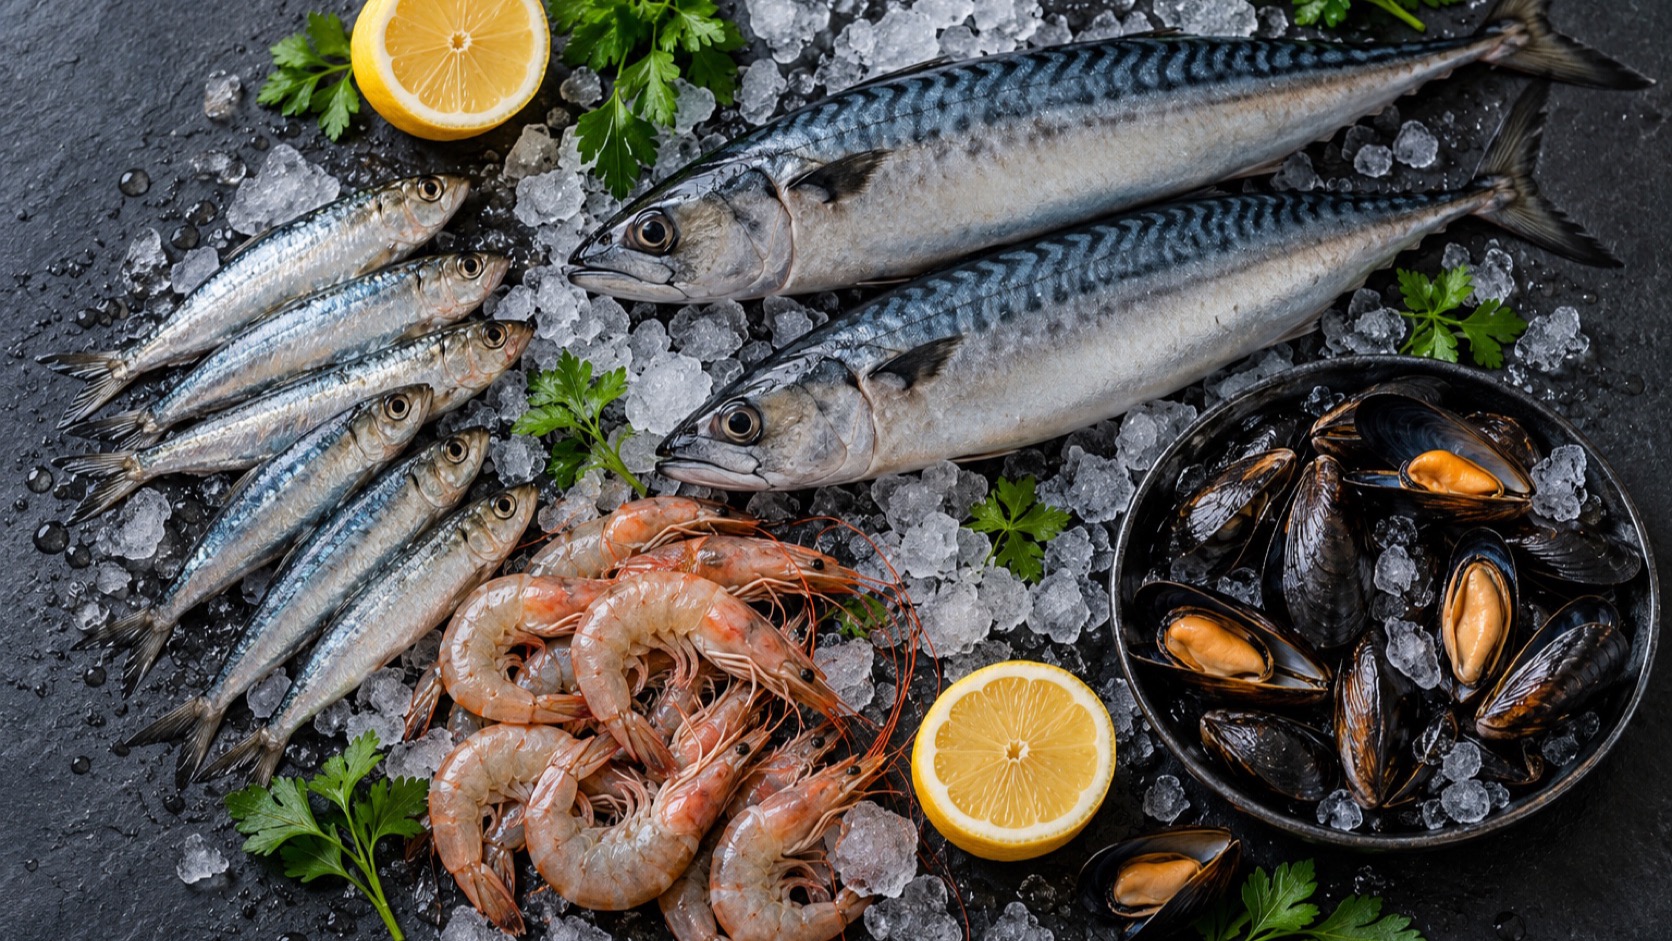
Every species on the seafood counter — fatty or lean — delivers the same baseline: high-quality, complete protein, containing all essential amino acids, at roughly 19 to 23 g per 3-oz cooked serving. That is the same order of magnitude as chicken breast or lean beef, which is what makes fish a genuine substitution for land meat rather than a side dish. The USDA's FoodData Central is the source for these figures, and the spread between species is small: the nutritional drama happens in the fat and micronutrient columns, not the protein one.
For people working on total protein intake — the protein topic covers why that matters with age — seafood is simply one of several dense sources, with a micronutrient profile that most other dense sources don't match.
The Micronutrient Sheet
This is the part of the package the omega-3 conversation skips. Values below are rounded database averages for a 3-oz cooked serving; exact figures vary by species and origin.
| Nutrient | What seafood supplies | Standout sources | Scarcity context |
|---|---|---|---|
| 🧀 Vitamin B12 | Roughly a full day's value per serving of salmon or trout | Salmon, trout, tuna, sardines, clams (clams run far higher still) | Rare in plants |
| ☀️ Vitamin D | A serving of salmon supplies near the daily value | Salmon, herring, sardines; lean fish carry much less | Few natural foods |
| 🛡️ Selenium | A day's value or more in most fin fish; tuna well above | Yellowfin tuna, halibut, sardines, shrimp | Widely available |
| 🧂 Iodine | Cod supplies most of a day's value per serving | Cod, shrimp, other marine fish; seaweed far higher | Patchy in diets |
| 🔩 Iron & zinc | Useful amounts; shellfish run notably higher | Oysters, clams, mussels for both | Moderate source |
The scarcity-context column is the quiet argument for seafood in a general diet: B12 exists naturally only in animal foods, natural vitamin D is limited to a short list (oily fish near the top of it), and iodine depends heavily on marine foods or iodized salt. None of that says anything about outcomes — it just describes what is hard to replace if fish leaves the menu.
Where the Omega-3s Actually Live
Since this is the nutrients page, one composition map belongs here: EPA and DHA concentrate in cold-water oily fish, while lean white fish and shellfish carry little. Salmon is generally much richer in EPA and DHA than lean white fish, though amounts vary by species and product; NIH ODS notes that a general recommended intake for EPA and DHA has not been established, and AHA guidance is expressed as seafood servings per week rather than a daily EPA+DHA target. Reaching a salmon-like omega-3 intake from cod would take multiple servings. The parent topic owns the full omega-3 story and the supplement page owns the capsule side; the chart below is the composition spread.
Wild, Farmed, Canned: How Processing Moves the Numbers
- 🐟 Farmed isn't a downgrade across the board: the AHA advisory notes farmed salmon and trout run higher in long-chain omega-3s than wild in USDA comparisons, while farmed catfish and crawfish run lower. Farm feed composition drives the number — which is also why it drifts over time.
- 🥫 Canning preserves most of the package: protein, B12, and omega-3s survive canning well. Canned salmon with soft edible bones adds a meaningful calcium contribution that fresh fillets don't offer. The tradeoff is sodium in some packed products and oil choice in packed tuna.
- 🐠 The fish's diet sets its fat profile: NIH notes omega-3 content depends on what the fish itself ate — true for wild and farmed alike, and a reason database averages carry error bars.
- 🧊 Freezing is nutritionally cheap: freezing is a storage method, not a transformation; the macronutrient and micronutrient profile is essentially unchanged.
- 🍳 Cooking method changes the fat story: what you add in the pan matters — see the preparation page.
📌 Composition is not destiny
Everything on this page is a measurement of what is in the food. None of it, by itself, says that eating seafood improves health, extends life, or protects anything — those claims require the outcome studies summarized on the cardiovascular patterns page, with all their observational caveats. The composition sheet earns fish a place in the conversation; the outcome evidence has to earn the rest.
A Week of Fish Without Cooking a Whole One
The composition sheet is easiest to act on with formats that remove friction. Frozen individually portioned fillets, canned fish, and simple oven methods cover the full nutrient package above with minimal technique:
- 🥫 Sardines on toast: roughly a full serving's omega-3s, B12, and — eaten with bones — a calcium contribution almost no other fish format offers.
- 🐟 Frozen salmon portions: bake from thawed at 400°F for 12–15 minutes to 145°F; the vitamin D and omega-3 numbers in the chart hold for farmed fillets.
- 🥗 Canned tuna bowl: light tuna brings ~0.3 g EPA+DHA per serving — modest next to salmon, but the protein, B12, and selenium arrive at full strength.
- 🍤 Shrimp skewers: the lean-shellfish pattern — full protein, solid selenium and B12, minimal omega-3s. Pairing oily and lean species across a week covers both columns.
- 🧂 Watch the sodium line: some canned and smoked products carry most of a day's sodium per serving — the package, not the fish, is doing that.
The 3-Ounce Reference Frame
Every number on this page uses the same reference serving: 3 ounces (about 85 g) of cooked fish — roughly a deck of cards, or a bit less than the FDA's palm-of-the-hand adult guide for a 4-oz raw portion that cooks down. Keeping the frame in mind prevents two common misreadings. First, restaurant portions run 6 to 9 ounces cooked, so a single salmon dinner can deliver two or three "servings" of every nutrient above — relevant when a chart value says "a day's worth" and your plate held triple that. Second, percentage-of-daily-value figures are anchors for a 2,000-calorie reference diet, not personal requirements; your own needs shift with age, size, and health status. The composition facts are stable — the arithmetic belongs to your actual portion.
Questions, Answered Briefly
- 🐟 Do lean fish like cod carry anything worth eating? Yes — full protein quantities, B12, selenium, and cod is notably strong on iodine. What lean fish lack is the omega-3 and vitamin D payload of oily species.
- 🥛 Is fish a calcium source? Fresh fillets, not really. Canned salmon or sardines with bones are — the soft bones are edible and calcium-dense.
- ☀️ Can fish cover vitamin D needs? Oily fish are one of the few meaningful natural food sources, but intake varies by species and serving frequency, and sun exposure and supplements change the equation — the vitamin D topic owns that question.
- 🦐 Is shellfish nutritionally second-class? No — shrimp, scallops, clams, and oysters deliver the same protein plus concentrated B12, iron, zinc, and (in bivalves) exceptional B12. Their omega-3 content is modest, that's all.
- 💪 How does fish compare to chicken for protein? Gram for gram, roughly equal. The difference is everything packaged with the protein: the fat profile, B12, D, selenium, iodine versus chicken's own profile.
The Bottom Line
- Every serving brings ~20 g of complete protein — species barely differ; fish is a true portion-for-portion swap for land meat.
- The micronutrients are the differentiator — B12 near a day's value, vitamin D from a short natural-source list, plus dense selenium and iodine.
- Oily species carry the omega-3 payload — salmon is far richer in EPA and DHA than lean species; no universal daily EPA+DHA target is established.
- This is a factsheet, not a promise — composition data describe the food; outcome claims live with the cohort evidence and its caveats.
Related Topics
- U.S. Department of Agriculture, Agricultural Research Service, FoodData Central — fdc.nal.usda.gov
- National Institutes of Health, Office of Dietary Supplements, "Omega-3 Fatty Acids — Health Professional Fact Sheet" — ods.od.nih.gov
- NIH ODS fact sheets: Vitamin B12, Vitamin D, Selenium, Iodine
- Rimm EB et al., "Seafood Long-Chain n-3 Polyunsaturated Fatty Acids and Cardiovascular Disease: A Science Advisory From the American Heart Association," Circulation (2018) — ahajournals.org
- U.S. FDA / EPA, "Advice About Eating Fish" (revised October 2021) — fda.gov