Carb Quality Taxonomy
"Carbohydrate" is one word for molecules that share almost nothing metabolically — lentils and lemonade are both "carbs." Sorting them properly takes three layers: glycemic load, food structure, and the fiber that coats the starch. This page builds the taxonomy and shows where each layer earns its keep.
What the evidence supports
- Whole grain intake is associated with lower cardiovascular and all-cause mortality — about 22% and 17% lower per 90 g/day, respectively (BMJ, 2016).
- High-glycemic-load diets are associated with higher type 2 diabetes risk in meta-analyses of cohorts (Am J Clin Nutr, 2008; Nutrients, 2019).
- The same grams of carbohydrate from intact versus refined sources produce different glucose responses — the structure effect is real.
What remains uncertain
- In the OmniCarb RCT, swapping glycemic index on an already-good diet changed little — the index's independent contribution is smaller than the taxonomy suggests (JAMA, 2014).
- Whether glycemic load matters beyond fiber and whole-grain structure is genuinely debated.
- Individual glucose responses to identical foods vary widely — a food's index is a population average, not your number.
Evidence last reviewed: August 15, 2026. Conclusions may change as new research is published.
Product picks are generic categories, not brands. We may earn a commission on Amazon or iHerb purchases at no cost to you — this never changes our evidence conclusions. Full disclosure
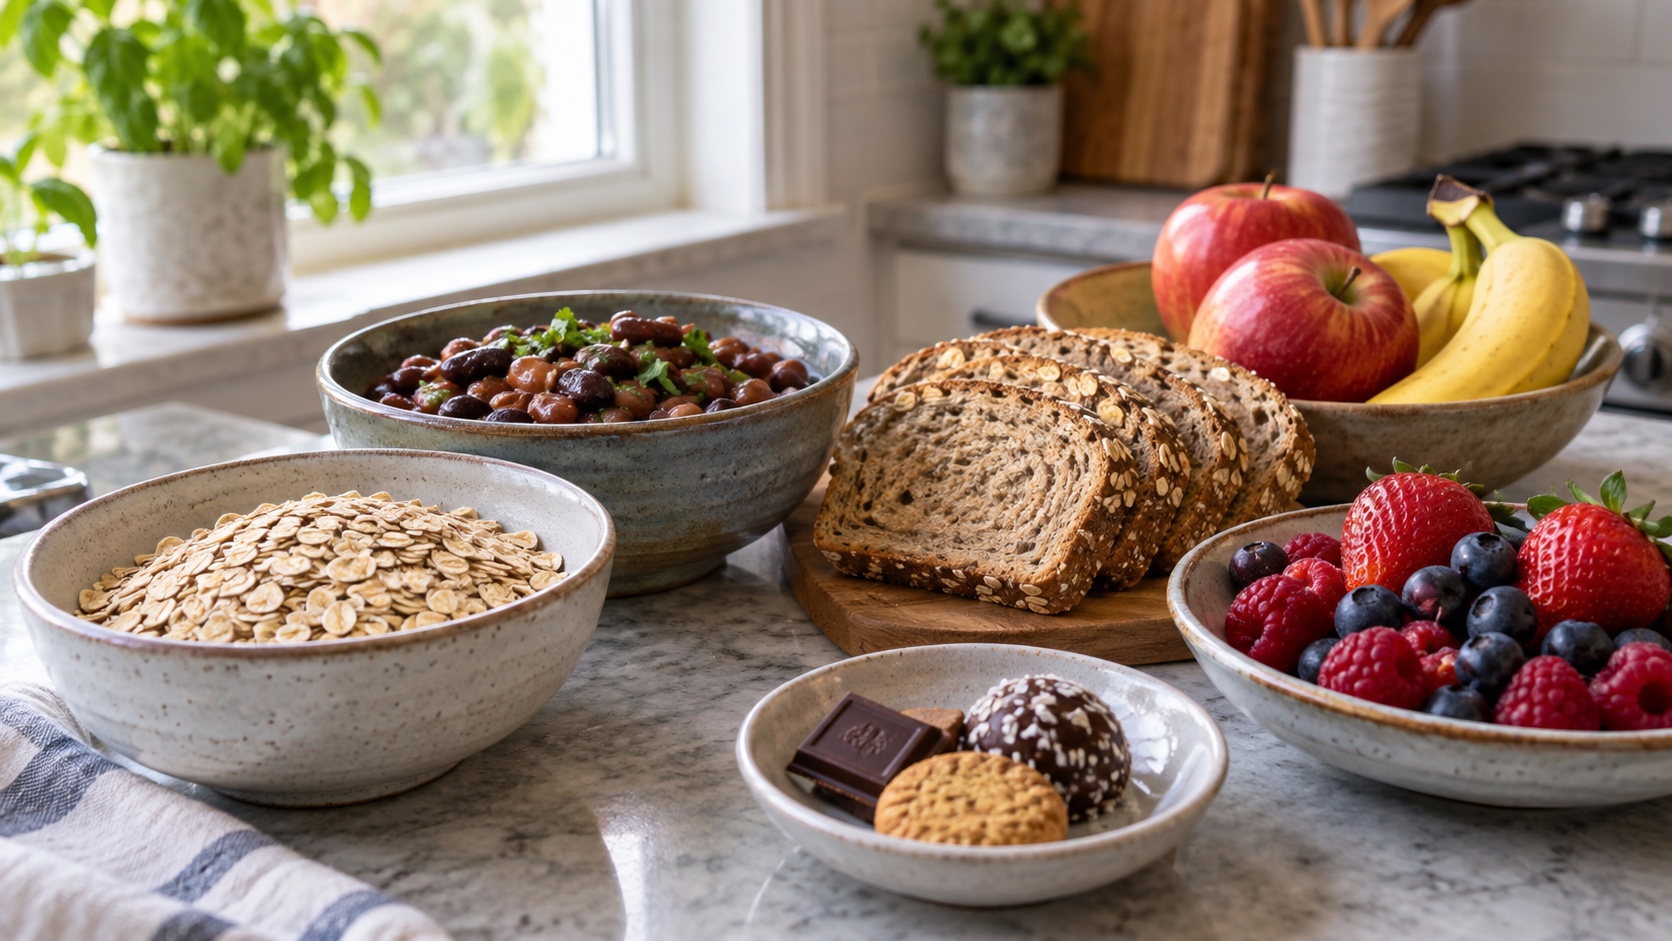
Rolled oats
A soluble-fiber food option where an article specifically teaches oats as part of a gradual fiber increase.
⚠️ Increase fiber gradually; GI symptoms vary and gluten cross-contact matters for people who require certified gluten-free products.
Check price on Amazon →Three Layers of Quality
A useful carb taxonomy sorts food by three layers, in this order of importance. First, structure: is the grain intact, ground, or refined into powder? An oat groat, rolled oats, and oat flour are the same seed with three different digestive behaviors. Second, glycemic load: how much glucose does a serving actually deliver, and how fast? Third, the co-passengers: fiber, protein, minerals, and polyphenols that travel with the starch. Most carb advice collapses all three layers into "good carbs and bad carbs," which is why it keeps failing: white rice and lentils sit on different layers, and so do oatmeal and oat cookies. The parent topic gives the four-aisle overview; here we build the sorting rules.
The Glycemic Load Math
Glycemic index (GI) ranks foods by how fast 50 available grams of their carbohydrate raise blood glucose; glycemic load (GL) fixes the index's famous blind spot by multiplying by actual serving size: GL = GI × grams of carbohydrate ÷ 100. Worked example: watermelon has a high GI of about 72, which sounds alarming — but a 120 g slice carries only about 7 g of available carbohydrate, so its load is about 5. A white bagel has a similar GI but packs roughly 55 g of carbohydrate, so its load is about 38 (values from the international GI tables, Diabetes Care, 2008). The index alone would call the two foods equal; the load calls the bagel the bigger glycemic event by a factor of seven. The practical rule follows: index tells you what a food is; load tells you what a serving does — and servings are what people actually eat.
The Structure Effect
Structure is the layer the index tables miss. The same wheat kernel behaves differently as cooked berries, as coarse flour, and as white flour — and the glucose response follows the grinding, not the grain. Whole fruit is the cleanest example: the sugar is trapped inside intact cell walls, so an apple delivers its fructose slowly with fiber, while the same sugar juiced arrives in minutes. Blending occupies a middle ground the evidence has not fully mapped. The fiber topic owns the dose-response numbers; the structure principle explains why fiber works better in a food than in a capsule — it physically slows the starch it came with. If you remember one line from this page: the fiber coating the starch matters more than the index of the starch.
Whole Grains: The Dose-Response
The strongest numbers in carb science belong to whole grains. In a dose-response meta-analysis of prospective studies, each 90 g/day of whole grain intake — roughly three servings, a bowl of oats plus two slices of whole-grain bread — was associated with 22% lower cardiovascular mortality, 17% lower all-cause mortality, and about 15% lower cancer mortality (BMJ, 2016). The association is graded: more whole grain, lower risk, with the steepest gains between zero and three servings a day. The Lancet's carbohydrate-quality series reached the same conclusion from the other direction, tying fiber and whole grains to lower risk of type 2 diabetes, cardiovascular disease, and colorectal cancer (Lancet, 2019); the fiber subtopic walks that series in detail. As always, these are associations from observational data — people who eat oats differ in other ways — but the dose-response shape and the feeding-trial mechanisms make this one of the more convincing patterns in nutrition.
| Carb class | Sources | The honest read |
|---|---|---|
| 🌾 Intact whole grains | Oats, quinoa, barley, brown rice | Beneficial — the dose-response backbone of this topic |
| 🫘 Legumes | Beans, lentils, chickpeas | Beneficial — the lowest-glycemic starch, plus protein |
| 🍎 Whole fruit | Apples, berries, citrus | Beneficial — fiber and water slow the sugar |
| 🥔 Starchy vegetables | Potatoes, sweet potatoes | Context-dependent — boiled sweet potatoes and deep-fried potatoes are different foods |
| 🍚 Refined grains | White bread, white rice, most pasta | Neutral to adverse — acceptable as a small share of a good pattern |
| 🥤 Sugary drinks | Soda, juice, sweetened tea | Minimize — liquid sugar with no satiety signal |
White Rice, Potatoes, and the GI Frontier
White rice is the taxonomy's stress test, because it feeds billions and is a staple, not a snack. The meta-analytic evidence is consistent: each additional daily serving of white rice is associated with about 11% higher risk of type 2 diabetes, with the strongest signal in Asian populations eating it most (BMJ, 2012). The fix is not to ban rice but to change its context — brown rice, or white rice with legumes and vegetables, which flattens the meal's glucose curve and adds fiber. Potatoes sit in a similar gray zone: boiled or roasted with skin, they are a reasonable whole food, but the cohort data on fries and chips trend adverse, and preparation dwarfs variety. The boundary line in the taxonomy is not between plants and other plants; it is between intact structure and industrial processing — the same line the sugar topic draws for sweetness.
A Worked Day: Rebuilding a Refined-Carb Menu
The taxonomy is easiest to trust when you watch it rebuild a typical day. Before: white toast with jam (refined, load high, fiber near zero), a deli sandwich on white bread with chips, pasta with jarred sauce, and a sweetened yogurt for dessert. After: steel-cut oats with berries and a spoon of nut butter; a bowl of lentils with vegetables and olive oil; a barley or quinoa base under roasted vegetables and fish; plain yogurt with fruit and nuts. The gram count of carbohydrate barely changes between the two days — what changes is the structure layer (intact versus powdered), the fiber coat, and the glycemic load, which falls by roughly half without any counting. That is the taxonomy's real job: it explains why two diets with the same carb arithmetic can have opposite metabolic signatures.
🧮 Don't run your life on a GI table
Glycemic index tables are population averages measured in labs, on isolated foods, in fasted people. Your meal — its fat, protein, fiber, and your own insulin response — routinely overrides the table's verdict. OmniCarb, a carefully controlled RCT, swapped high- and low-GI diets and found little change in insulin sensitivity or blood pressure on an otherwise healthy diet (JAMA, 2014). Use the index as a background signal; build meals from the structure layer instead.
Questions, Answered Briefly
- 📊 Should I track glycemic load? Not daily. The taxonomy is a sorting tool, not an accounting system. Choose intact grains, legumes, and whole fruit; let the load take care of itself.
- 🧃 Is fruit juice really as bad as soda? Close. Juicing strips the structure layer that makes fruit benign; the sugar then arrives like soda's. Whole fruit is the version the evidence supports.
- 🥣 Do instant oats count as whole grain? Yes, technically — but they are pre-ground, so they digest faster than steel-cut or rolled oats. Fine as a base; add protein and fruit to flatten the curve.
- 🥔 What about potatoes? Boiled or roasted, reasonable; fried, adverse. The potato's problem is mostly its preparation, not its starch.
- 🍝 What about pasta? White pasta is refined, but cooked al dente and eaten with vegetables, legumes, and olive oil, it behaves far better than the table suggests — again, the meal beats the ingredient.
- 🌽 Is corn a whole grain? Sweet corn is a starchy vegetable, not a grain; whole cornmeal and popcorn count as whole grains. The distinction matters less than the structure rule: intact beats ground.
The Bottom Line
- Sort carbs by structure first: intact beats ground, ground beats refined, every time.
- Glycemic load corrects the index: serving size turns a scary index into a practical number.
- The dose-response is real: about 22% lower cardiovascular mortality per 90 g/day of whole grains.
- Context upgrades staples: rice with beans, potatoes boiled — the meal, not the ingredient, sets the curve.
Related Topics
- Reynolds et al., "Carbohydrate quality and human health: a series of systematic reviews and meta-analyses," The Lancet (2019)
- Aune et al., "Whole grain consumption and risk of cardiovascular disease, cancer, and all cause and cause specific mortality: systematic review and dose-response meta-analysis of prospective studies," BMJ (2016)
- Atkinson et al., "International tables of glycemic index and glycemic load values: 2008," Diabetes Care (2008)
- Sacks et al., "Effects of high vs low glycemic index of dietary carbohydrate on cardiovascular disease risk factors and insulin sensitivity: the OmniCarb randomized clinical trial," JAMA (2014)
- Hu et al., "White rice consumption and risk of type 2 diabetes: meta-analysis and systematic review," BMJ (2012)
- Livesey et al., "Dietary glycemic index and load and the risk of type 2 diabetes: a systematic review and updated meta-analyses of prospective cohort studies," Nutrients (2019)
- Barclay et al., "Glycemic index, glycemic load, and chronic disease risk — a meta-analysis of observational studies," American Journal of Clinical Nutrition (2008)
- Ludwig et al., "Dietary carbohydrates: role of quality and quantity in chronic disease," BMJ (2018)