Home Measurement: The Cuff Ritual
A blood pressure reading is only as honest as the ritual that produced it. Measure with the wrong cuff, a crossed leg, or a full bladder and you get a number that scares you for nothing — or reassures you wrongly. This page builds the ritual: the right device, the five quiet minutes, and the seven-day baseline that turns noisy readings into a number worth acting on.
What the evidence supports
- Home blood pressure averages predict cardiovascular outcomes better than clinic readings (Hodgkinson, BMJ 2011).
- Standardized home measurement is reproducible enough to guide treatment decisions.
- Home monitoring plus clinician feedback measurably reduces blood pressure versus usual care.
What remains uncertain
- The exact protocol (two readings, seven days, discard day one) is expert consensus, not a randomized trial.
- White-coat effect varies by person and visit — the log estimates yours rather than measuring it precisely.
Evidence last reviewed: August 13, 2026. Conclusions may change as new research is published.
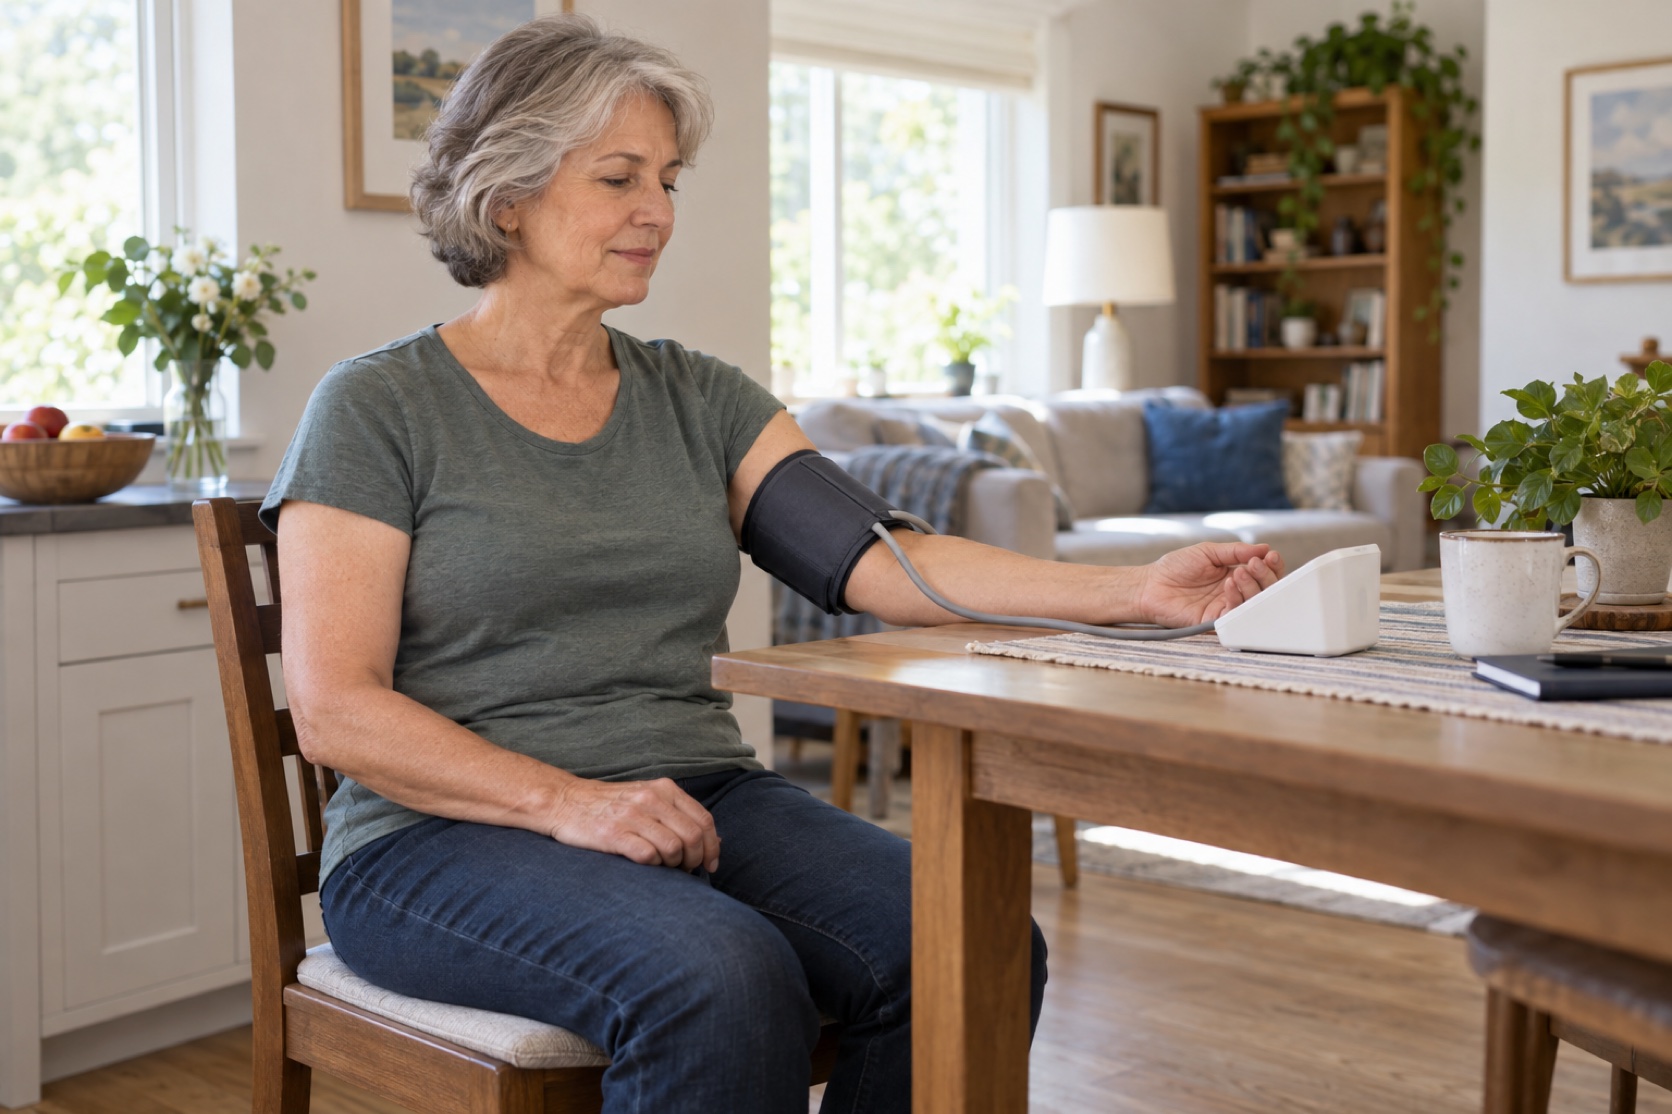
The Cuff Comes First
The device decides the data. A wrist cuff is tempting — small, cheap, wearable-looking — and some wrist models have passed validation, but they demand exact wrist-at-heart positioning that fails in practice more often than not. The validated upper-arm cuff removes the variable that most often goes wrong. Validation means the device agreed with a reference measurement across a wide range of pressures and arm sizes — a pass/fail engineering test, not a marketing claim.
- 🏆 Validated, not famous — independent lists like STRIDE BP (US Blood Pressure Validated Device Listing) and Medaval track devices that passed accuracy testing against the reference standard. Brand reputation is not validation.
- 💪 Upper-arm over wrist — wrist devices can be accurate but only when held exactly at heart level; the upper-arm cuff removes that judgment call.
- 📏 Size matters — the inflatable bladder should cover about 80% of the arm's length around and 40% of its width. A too-small cuff overestimates pressure by several mmHg, sometimes more.
- 💲 Honest cost — a validated device with memory runs $40–100. That is among the highest-value health purchases on this site.
- 🔋 Features that matter — memory with averaging, a large display, and the right cuff size. Bluetooth and app subscriptions are nice-to-haves; accuracy does not live in the app.
| Arm circumference | Cuff size | Typical fit |
|---|---|---|
| 22–26 cm | Small adult | Slimmer or older arms |
| 27–34 cm | Standard adult | Most adults |
| 35–44 cm | Large adult | Muscular or larger arms |
| 45–52 cm | Adult thigh cuff | Upper-arm use at larger sizes |
Measure the bare mid-arm once, then buy the band that matches. Many monitors ship with a standard cuff only — check before you check out.
The Five Minutes Before
The reading responds to the last half hour of your life: caffeine, stairs, a phone call, a full bladder. The five-minute seated rest is what lets the measurement describe your body rather than your morning.
- 🪑 Sit five minutes — back supported, feet flat, legs uncrossed, no talking. The "alerting response" that inflates early readings settles during those minutes.
- ☕ The 30-minute rule — no caffeine, exercise, or nicotine in the 30 minutes before measuring. Coffee can transiently add 5–10 mmHg.
- 🚻 Empty the bladder — a full bladder can add several mmHg to the systolic number.
- 🤫 Silence during the reading — talking raises pressure while you're saying it; wait until after the cuff deflates.
- 📅 Same time-ish, every day — morning readings cluster before breakfast and meds, evenings before dinner. The schedule does as much for comparability as the rest does.
Product picks are generic categories, not brands. We may earn a commission on Amazon or iHerb purchases at no cost to you — this never changes our evidence conclusions. Full disclosure
Meditation cushion or supportive chair accessory
May make a meditation practice more physically comfortable.
⚠️ None expected; meditation can be difficult or unsettling for some people and is not a replacement for mental-health care.
Check price on Amazon →The Ritual, Exactly
Seven moves, same order, every time. Consistency is what makes the baseline comparable day to day:
- 🪑 Sit — a chair with back support, both feet flat on the floor, legs uncrossed.
- 💪 Bare the arm — cuff on skin, not over a sleeve.
- 📍 Place the cuff — 2–3 cm above the elbow crease, tube over the inner arm, snug enough to slip two fingers under.
- ❤️ Arm at heart level — rest the forearm on a table so the middle of the cuff sits at mid-chest. A dangling arm reads high.
- 🤐 Reading one — no talking, no phone, breathe normally.
- ⏱️ Wait a minute — then reading two, same arm.
- 📓 Log both — write both numbers down, every time, with the time of day.
The Seven-Day Baseline
One day of readings is weather; seven days is climate. The baseline exists because blood pressure moves with sleep, stress, salt, and chance — and only the week-long average smooths all of that out.
- 🌅 Mornings — after waking and the bathroom, before breakfast, medications, and coffee.
- 🌆 Evenings — before dinner, or at least an hour after eating; roughly the same time each day.
- 🔢 Two and two — two readings a minute apart, morning and evening, for seven days.
- 🗑️ Discard day one — the first day runs high on novelty and unfamiliarity; it teaches the ritual, nothing more.
- 🧮 Average the rest — days 2 through 7, all 24 readings, one number. That is your baseline.
- 🎯 What the baseline is for — it's the number every later re-check gets compared against. Without it, "my pressure is a bit high" stays a feeling instead of a measurement.
The Number, Categorized
The baseline average lands somewhere in the 2017 ACC/AHA table below — the categories used in the United States. Two honest caveats: these are office-clinic categories, and home readings run about 5 mmHg lower, so a home average of 135/85 carries roughly the weight of a clinic 140/90. And a single reading never decides anything.
| Category | Systolic (mmHg) | Diastolic (mmHg) | Verdict |
|---|---|---|---|
| Normal | <120 | <80 | Good Keep going |
| Elevated | 120–129 | <80 | Moderate The warning track — lifestyle is the move |
| High BP, Stage 1 | 130–139 | 80–89 | Moderate Start the protocol, re-check in 4 weeks |
| High BP, Stage 2 | ≥140 | ≥90 | Severe Protocol plus a clinician conversation |
If systolic and diastolic land in different categories, the higher one rules. The categories describe untreated adults; if you're already on medication, the same numbers describe how well your treatment is working.
If your average lands in Elevated or Stage 1, the next pages in this series are the plan — and the number you just produced is the yardstick they're judged against. In Stage 2, the protocol and a clinician conversation run in parallel rather than in sequence.
The Averaging Rule
Everything on this page exists to produce one number. The rules for getting there:
- 📈 Spikes are noise — a bad night's sleep or last night's salt shows up as a high single reading. The average absorbs it; that's its job.
- 🌗 Morning vs evening — evenings often run lower than mornings. Average them together rather than cherry-picking the friendlier half of the day.
- 💪 One arm, usually — measure both arms during the baseline week, then use the higher-reading arm going forward. A persistent 10+ mmHg gap between arms is worth mentioning to a clinician.
- 📅 Missed a session? — extend the baseline a day. The floor for a usable average is three full days (12 readings); seven days is the standard.
- 🚨 The red line — a reading at or above 180/120 means re-check after five quiet minutes; if it holds, or symptoms come with it (chest pain, shortness of breath, vision changes), that's urgent care, not a protocol.
🧮 The average is the number
Single readings are weather; the seven-day baseline is climate. Judge the average against the category table — not your best day, not your worst.
White-Coat Effect: Bring the Log
If your clinic numbers run higher than your home log, you are not unusual — roughly 15–30% of people with elevated clinic readings have normal readings at home. The white-coat effect is real, it's common, and your log is the evidence that separates it from the real thing.
- 👨⚕️ The clinic premium — stress, rushing, and a rushed measurement combine; clinic readings commonly run ~10 mmHg above home, sometimes more than 20.
- 📓 The log is your advocate — a clean seven-day home log often changes the conversation from "start a medication today" to "let's watch this for three months."
- 🎭 The masked twin — the opposite pattern exists too: normal at the clinic, high at home. The log catches what the waiting room hides.
- 🧾 Bring it — printed or screenshotted: dates, times, all readings, and the average. A log is worth more than any single clinic number.
- 🏠 Home monitoring alone isn't the treatment — the benefit in trials comes from home measurement plus acting on the numbers. The log is evidence; the protocol is the action.
When to Re-Check
The cadence depends on what just changed — active change means measuring more, stability means measuring less:
| Situation | Re-check plan | Why |
|---|---|---|
| During the 8-week protocol | A 3-day mini-baseline each week | Catches the levers working |
| After changing diet, exercise, or medication | A full 7-day run at 2–4 weeks | That's how long most effects take |
| Numbers stable and healthy | A 7-day run every 3–6 months | About 14 measuring days per year |
| Feeling off — dizzy, headache, chest symptoms | Measure now; 180/120 or symptoms = urgent care | Symptoms outrank schedules |
Once a year, bring the device itself to a clinic visit and check it against the office reading. Devices drift, cuffs leak, and a five-minute comparison catches both.
Where the Evidence Lives
This page is the measuring layer — the science behind each number has a home in the pillars, and this series references rather than repeats it:
- 🫀 Why blood pressure matters at all — the Blood Pressure science topic owns the physiology and the risk case; this series is the operational layer.
- 🚶 The aerobic engine — the Walking topic covers the exercise dose that pulls pressure down between measurements.
- 😴 The apnea interference — the Sleep Apnea topic explains why untreated apnea defeats every other lever.
- 🧂 What to change once you have the number — the Sodium Audit & Potassium Build is the next page in this series.
What to Do When It Goes Wrong
Measurement goes wrong in predictable ways — and almost all of them have a same-day fix:
- 🚩 Readings jumped 15 mmHg for no obvious reason — run the technique audit first: cuff size and position, arm supported, five-minute rest, no talking. Then re-measure. One odd evening does not overturn a baseline.
- 🚩 The first reading is always high, the second always lower — that's the normal alerting response. Log both anyway; the protocol averages them exactly as designed.
- 🚩 The cuff doesn't fit your arm — use the sizing table above. A too-small cuff overestimates; buy the right band, and know that most monitors ship with standard only.
- 🚩 Home looks fine, the clinic looks scary — white-coat effect. Bring the log; for most decisions the home average wins. If proper repeat clinic readings also confirm elevation, the log still helps titration.
- 🚩 You don't trust the device — check batteries and cuff leaks, then bring the monitor to your next clinic visit and compare it against theirs. Replace validated devices every five years or so.
Questions, Answered Briefly
- ❓ Is a wrist cuff okay? — Some validated wrist devices exist, but they demand exact wrist-at-heart positioning that fails in practice. The validated upper-arm cuff is the default for a reason.
- ❓ Morning or evening — which matters more? — Both; the protocol averages them. Mornings tend to run highest, but a full picture needs evenings too.
- ❓ Why is my first reading always the highest? — The alerting response. That's why the ritual takes two readings a minute apart and why day one gets discarded.
- ❓ Do I have to measure forever? — No. Weekly during active changes, a seven-day run every 3–6 months once stable — about 14 days of measuring a year.
The Bottom Line
- The validated upper-arm cuff, sized to your arm, is the foundation — everything downstream inherits its quality.
- Two readings AM, two PM, seven days, discard day one — the baseline is the average of days 2–7.
- Judge the average, never a single reading — spikes are weather; the baseline is climate.
- Home 135/85 ≈ clinic 140/90 — bring the log to every appointment; it changes conversations.
This Page in One Workflow
- Buy — a validated upper-arm cuff, with the band that fits your measured arm.
- Sit — five quiet minutes; nothing with caffeine in the half hour before.
- Measure — two readings, morning and evening, seven days.
- Average — discard day one; average days 2–7 into one number.
- Judge — the average against the category table, and hand the log to your clinician.
The Daily Checklist
- Two morning readings, a minute apart, before meds and coffee
- Two evening readings, before dinner or an hour after eating
- Five-minute seated rest before the first reading — no phone
- Both numbers logged with date and time
- No caffeine, exercise, or nicotine within 30 minutes of measuring
- Any 180/120 re-checked after five quiet minutes — urgent care if it holds or symptoms appear
The Weekly Checklist
- Weekly average computed — that's the number that matters
- 3-day mini-baseline run during active protocol weeks
- Day-one readings kept out of the running average
- Cuff fit and batteries checked
- Log printed or screenshotted for the next clinician visit
Go Deeper: Home Measurement
These five companion pages turn the topic into smaller, testable practices.
- 🔗 The cuff purchase guide
- 🔗 The measurement protocol
- 🔗 The 7-day baseline
- 🔗 The white-coat & masked patterns
- 🔗 The tracking format
Related Topics
- Whelton PK, et al. "2017 ACC/AHA/AAPA/ABC/ACPM/AGS/APhA/ASH/ASPC/NMA/PCNA Guideline for the Prevention, Detection, Evaluation, and Management of High Blood Pressure in Adults," Hypertension (2018)
- Hodgkinson J, et al. "Relative effectiveness of clinic and home blood pressure monitoring compared with ambulatory blood pressure monitoring in diagnosis of hypertension: systematic review," BMJ (2011)
- Stergiou GS, et al. "European Society of Hypertension practice guidelines for office and out-of-office blood pressure measurement," Journal of Hypertension (2021)
- Pickering TG, et al. "Call to action on use and reimbursement for home blood pressure monitoring: a joint scientific statement," Hypertension (2008)
- Verberk WJ, et al. "Self-measurement of blood pressure at home reduces the need for antihypertensive drugs: a randomized controlled trial," Hypertension (2007)
- STRIDE BP — US Blood Pressure Validated Device Listing, stridebp.org